Posted By Dwight on June 26, 2010

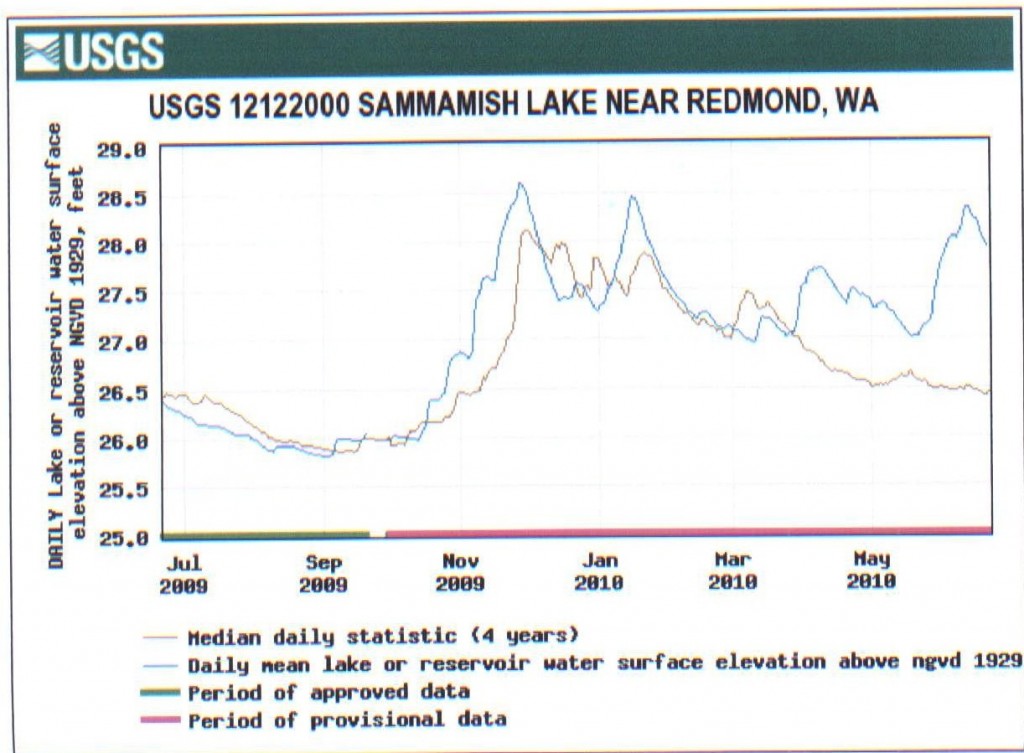
The above graph shows that we had some very high winter lake levels this year, but we were trending down to typical seasonal levels. Then Lake levels really spiked in April and June, quickly rising and slowly falling.
The blue line is this year, the brown line is an average of the previous four years, which shows an average June 1 level at about 26.5.
I Have asked both King County Flood Control and the Army Corp of Engineers why they think we are have such historic high levels. Although we have had a wet Spring, it has not been extreme, like the lake level has. I will report back as I learn more.
Dwight

Comments